What is Bubblemaps?
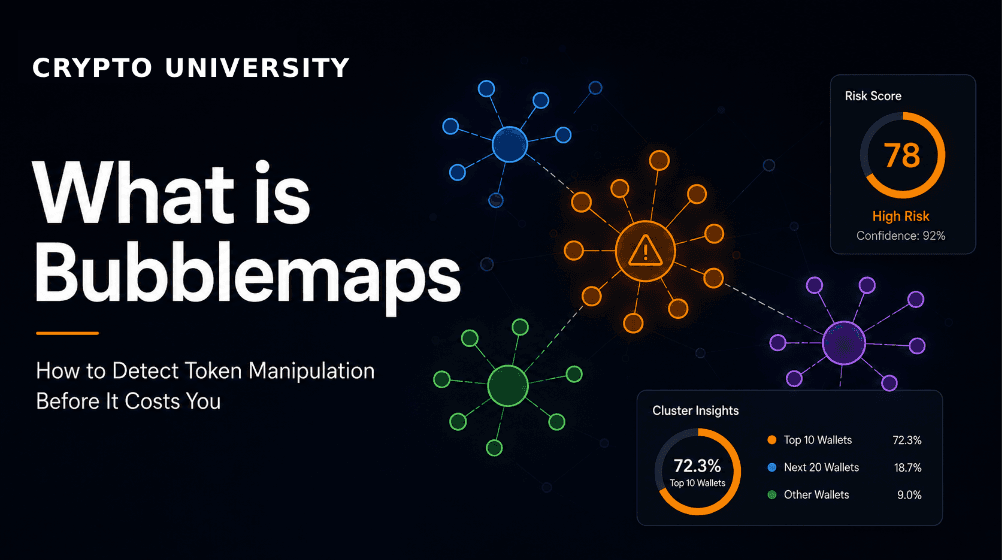
Bubblemaps is a free blockchain analytics tool that visualizes how a token's supply is distributed across wallets. It presents holder data as an interactive bubble map, where each bubble represents a wallet and the size of each bubble reflects the percentage of the token supply that wallet holds.
The key feature that makes Bubblemaps particularly useful is its ability to show wallet clusters. When multiple wallets are controlled by the same entity or coordinating group, Bubblemaps draws connecting lines between them. This makes it much easier to detect situations where a project team or early insiders secretly control a large portion of the token supply while appearing to have a distributed holder base.
Why Wallet Concentration Is a Risk
One of the most common ways new token holders lose money is through coordinated dumping by insiders. This works as follows: a project launches a token and distributes it across dozens of seemingly independent wallets. On the surface, it looks like the token has many holders and healthy distribution. In reality, those wallets are all controlled by the same person or group.
When enough outside buyers purchase the token and the price reaches a target, the insider wallets sell simultaneously. The sudden large sell pressure collapses the price, and outside buyers are left with tokens that have lost most or all of their value.
Bubblemaps does not prevent this from happening, but it makes the pre-existing warning signs more visible to a careful researcher.
How to Read a Bubblemaps Visualization
When you load a token on Bubblemaps, you see:
Bubbles.
Each bubble is a wallet that holds the token. Larger bubbles hold more of the supply. The percentage is shown when you hover over a bubble.
Connecting lines.
Lines between bubbles indicate that those wallets have interacted with each other on-chain, either through direct transfers or shared funding sources. Clusters of connected bubbles that collectively hold a large portion of supply are a significant warning sign.
Color coding.
Bubblemaps uses color to distinguish different types of wallets, such as exchange wallets, contract addresses, and user wallets. This helps filter out known benign concentrations (like exchange hot wallets) from potentially suspicious ones.
Top holders percentage.
Bubblemaps shows the percentage of total supply held by the top 10 and top 50 wallets. If the top 10 wallets hold 70% or more of a token's supply, that is a significant concentration risk regardless of whether those wallets are connected.
The Onchain Intelligence Layer | Bubblemaps
Step-by-Step: How to Check a Token on Bubblemaps
Step 1: Go to bubblemaps.io.
Step 2: Select the blockchain the token is on (Ethereum, BNB Chain, Solana, Avalanche, etc.).
Step 3: Paste the token's contract address into the search bar.
Step 4: Wait for the visualization to load. For newer or smaller tokens, data may take a moment to appear.
Step 5: Look at the overall distribution. Are a few large bubbles dominant?
Step 6: Look for clusters. Are there many smaller bubbles connected to a single large one? This can indicate wallets being funded from a common source.
Step 7: Check whether any single entity or visible cluster controls more than 20-30% of the supply. Higher concentration warrants caution.
No single metric makes a token a scam. But high concentration combined with connected wallets is one of the clearest red flags available in on-chain data.
What Bubblemaps Cannot Tell You
It cannot verify intent. A large holder may be a legitimate investor, a venture fund, or a market maker. Concentration alone is not proof of malicious intent.
It cannot catch sophisticated obfuscation. Advanced actors can spread supply across wallets that appear unrelated by using intermediary hops and timed transfers designed to break the visible connection chain. Bubblemaps will not catch every coordinated scheme.
It shows a snapshot in time. Wallet distributions change. A token might look well-distributed today and see large transfers tomorrow. Bubblemaps should be checked as close to the moment of your research as possible.
It does not evaluate project quality. Even a fairly distributed token can fail because the project itself has no real use case or team behind it. Distribution data is one component of research, not a complete picture.
Bubblemaps as Part of a Research Workflow
Experienced DeFi traders typically use Bubblemaps alongside other tools rather than in isolation:
DEXTools for liquidity and trading data, DEXT Score, and recent transaction history
Bubblemaps for visualizing holder concentration and wallet connections
Etherscan or Solscan for reading the raw contract code and transaction details
Community research from platforms like Twitter/X or Telegram to understand what the project claims to be doing
Together, these tools provide a more complete picture than any single source.
Pros and Cons
Pros:
Completely free with no account required, making it one of the most accessible research tools available for any trader regardless of budget
The visual format makes complex wallet relationship data immediately understandable, which is significantly faster to interpret than reading raw blockchain transaction lists
Supports multiple chains including Ethereum, BNB Chain, Solana, Avalanche, Fantom, and others, covering the majority of where new token launches occur
Cons:
Sophisticated manipulation schemes using indirect wallet funding or long chains of hops may not be visible in Bubblemaps' connection mapping
The tool shows wallet connections and concentration but does not provide context about whether large holders are legitimate investors, team members, or market makers
Bubblemaps is a research aid and does not protect users from loss; a token can pass a Bubblemaps check and still fail for unrelated reasons
FAQ
Is Bubblemaps free?
Yes. The core functionality is free with no account or subscription needed. You just paste a contract address and the visualization loads.
What chains does Bubblemaps support?
As of early 2026, Bubblemaps supports Ethereum, BNB Chain, Solana, Avalanche, Fantom, Arbitrum, Cronos, and several others. Coverage continues to expand.
What concentration level should concern me?
There is no single threshold, but if the top 10 wallets hold more than 30% of a token's supply, it merits close scrutiny. If those wallets also appear clustered or connected, caution is warranted. For memecoins and new launches, these figures often look much more extreme.
Can I use Bubblemaps on a phone?
Yes. The web app is mobile-compatible, though the interactive bubble visualization is easier to navigate on a desktop.
Does a clean Bubblemaps result mean a token is safe?
No. It means the visible on-chain distribution does not show obvious warning signs. This is one factor in due diligence, not a safety guarantee.
Related Terms
Disclaimer: This content is for educational and informational purposes only and is not financial advice. Nothing here is a recommendation to buy or sell any asset or use any platform. Do your own research and manage your risk.