What is CryptoQuant?
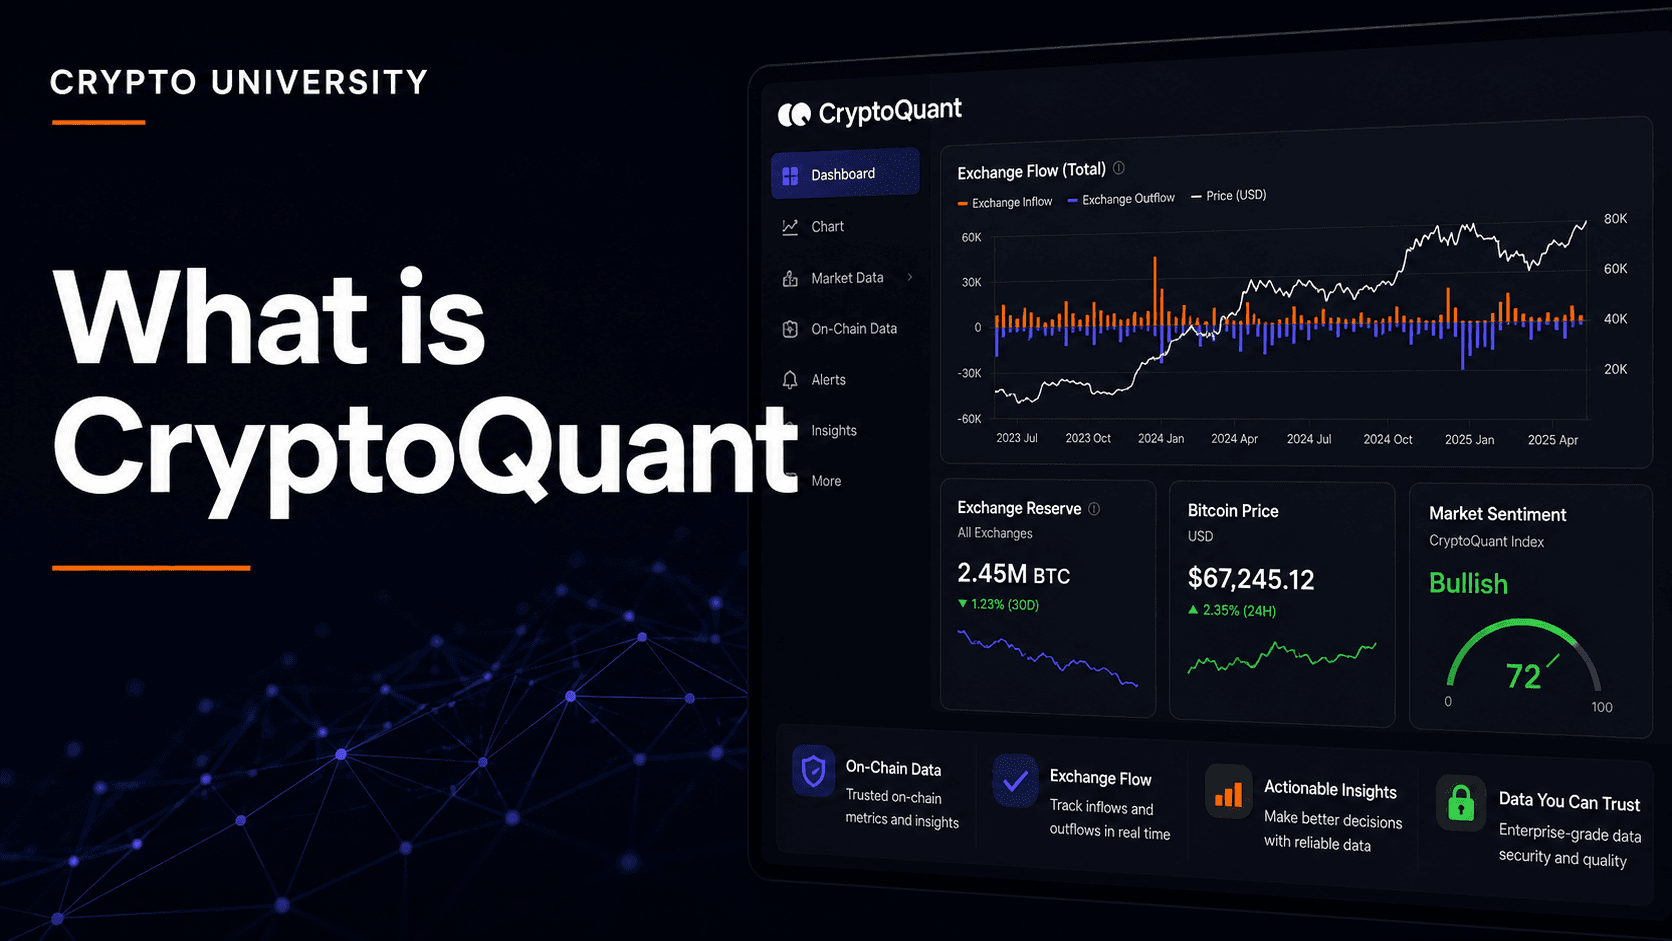
CryptoQuant is an on-chain analytics platform that specializes in exchange flow data, derivatives positioning, and miner behavior. It is widely used by traders who want to understand short-term market dynamics, particularly around whether large holders are moving coins onto exchanges to sell or pulling them off exchanges to hold.
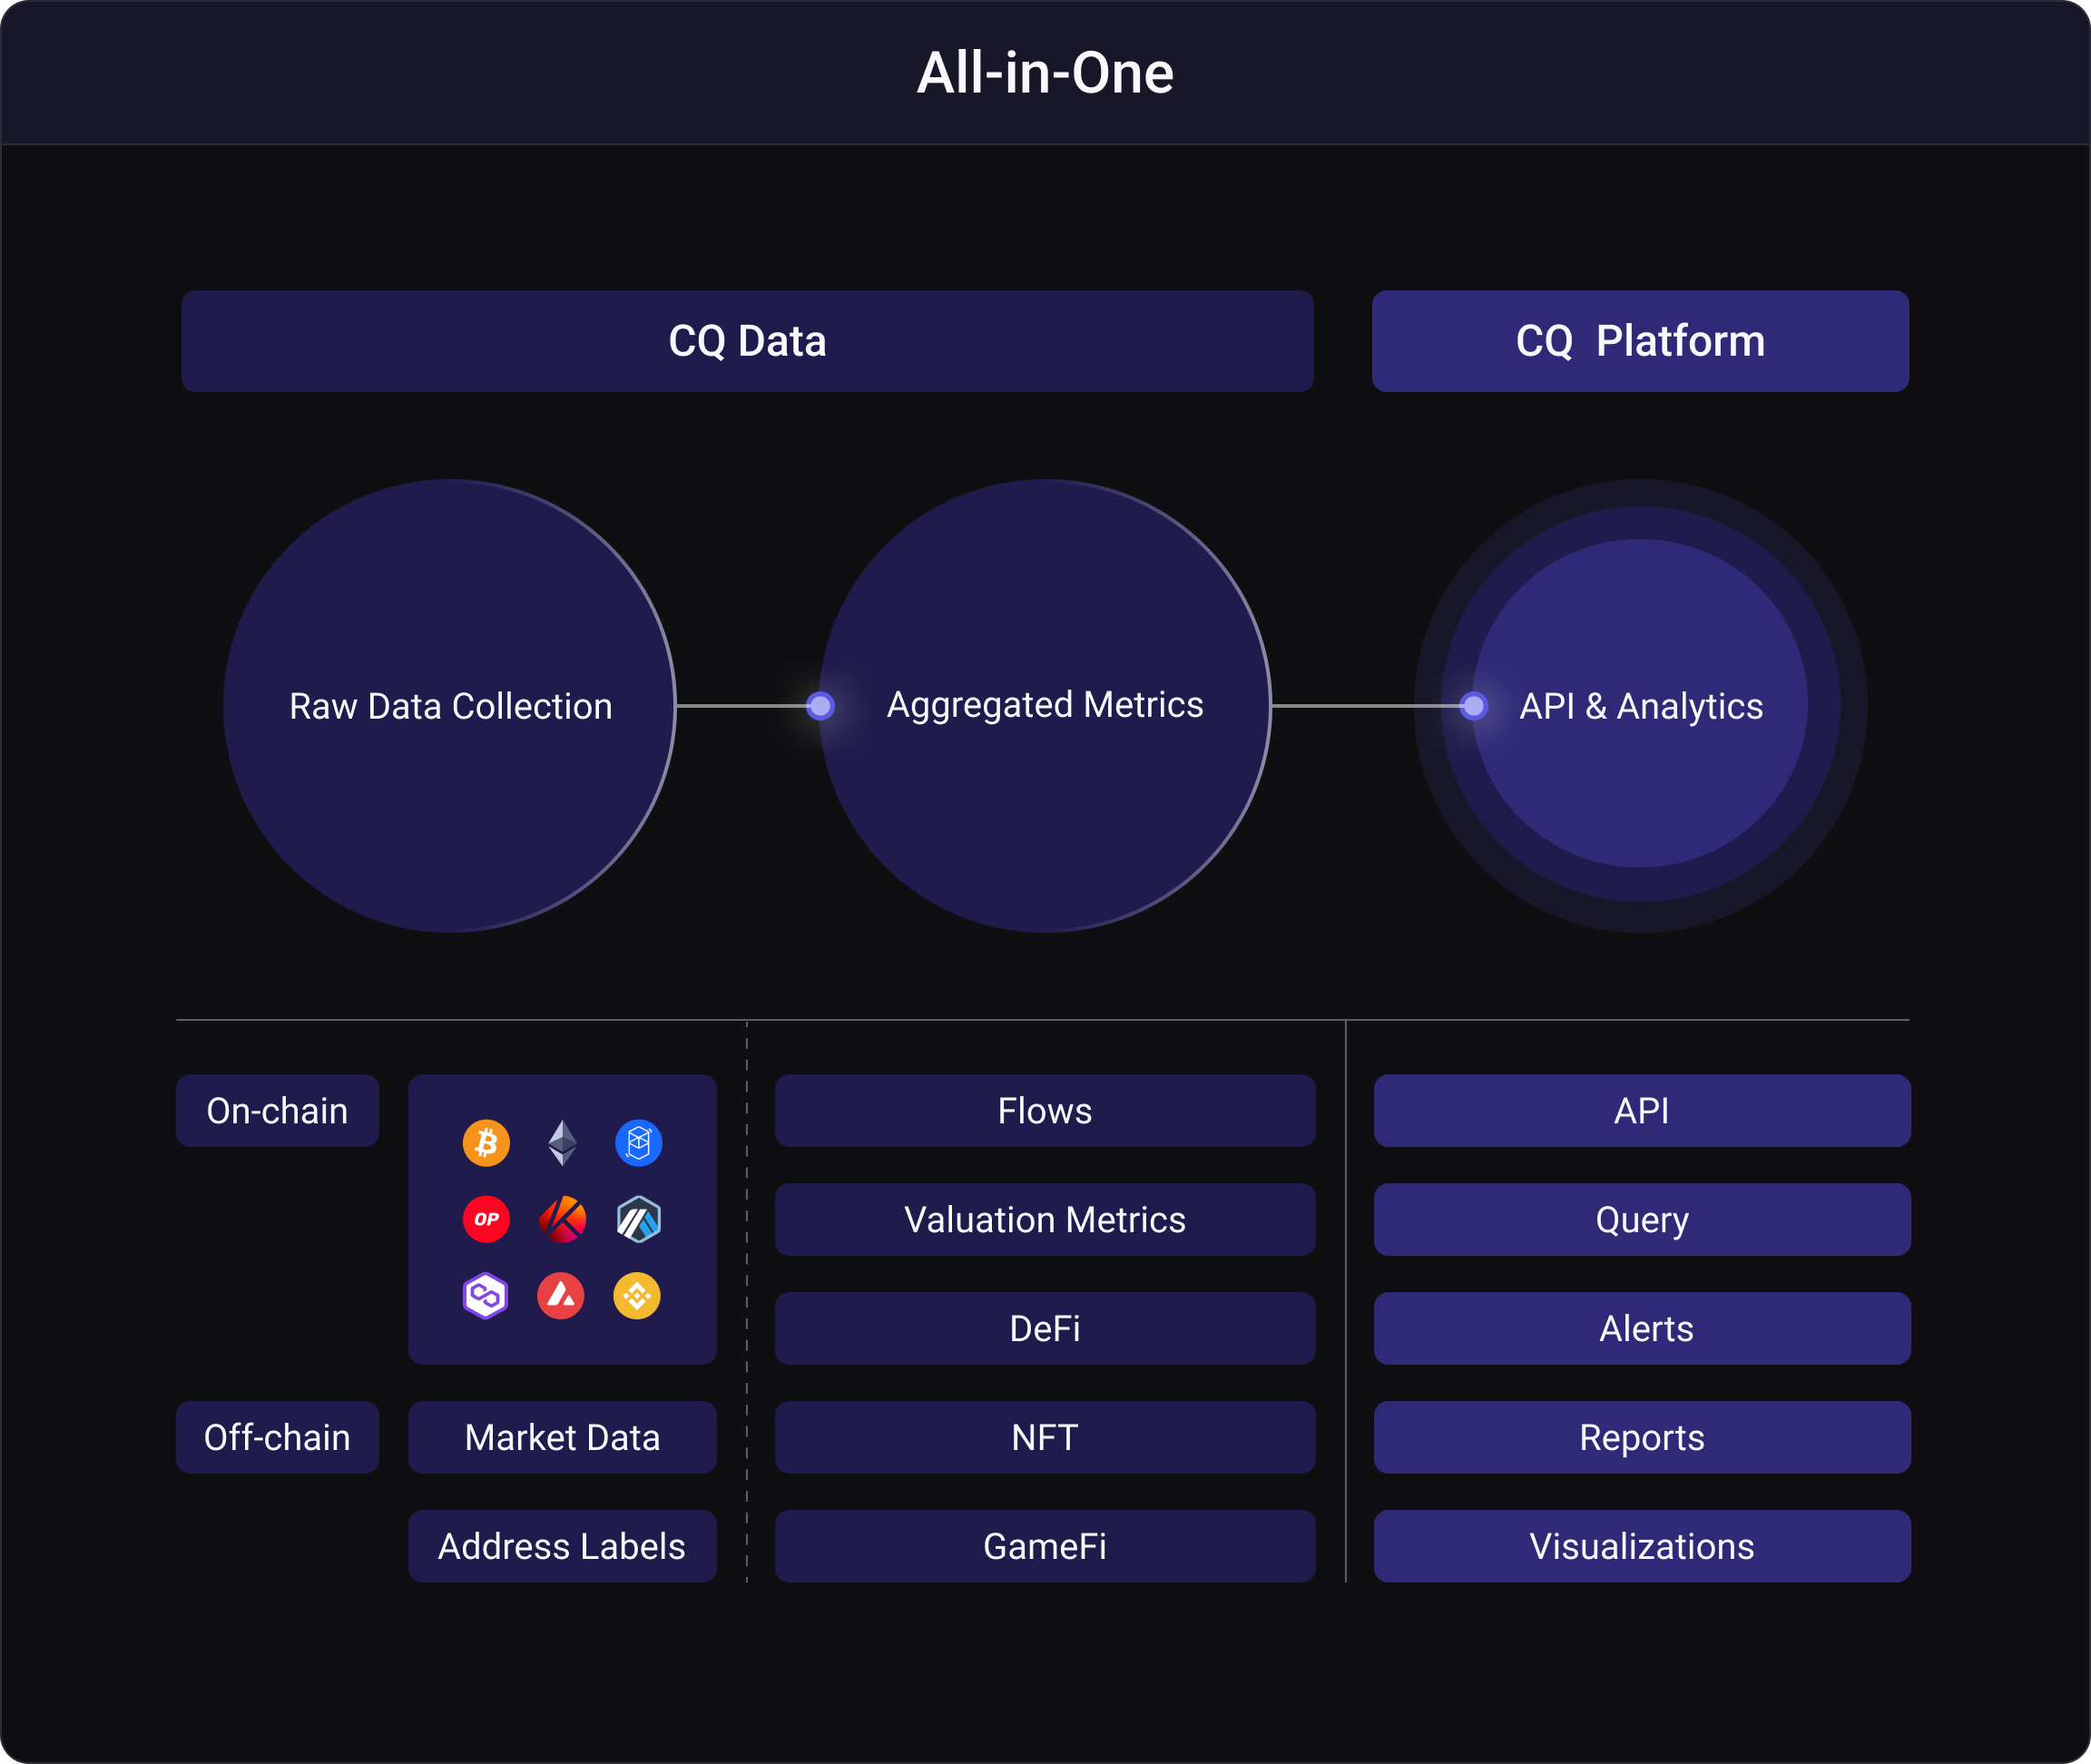
The platform aggregates blockchain data from over 200 crypto exchanges and wallets, making it one of the most comprehensive sources for exchange-level on-chain intelligence available to individual traders.
Why Exchange Flows Matter
When a significant amount of cryptocurrency moves from private wallets onto an exchange, it often signals that the holder is preparing to sell. When large amounts move off exchanges into private storage, it can indicate accumulation.
This logic is not perfect and does not hold in every case. But over time, exchange flow data has shown a meaningful statistical relationship with short-term price behavior. CryptoQuant's primary value is in making this data readable and trackable.
Key Metrics on CryptoQuant
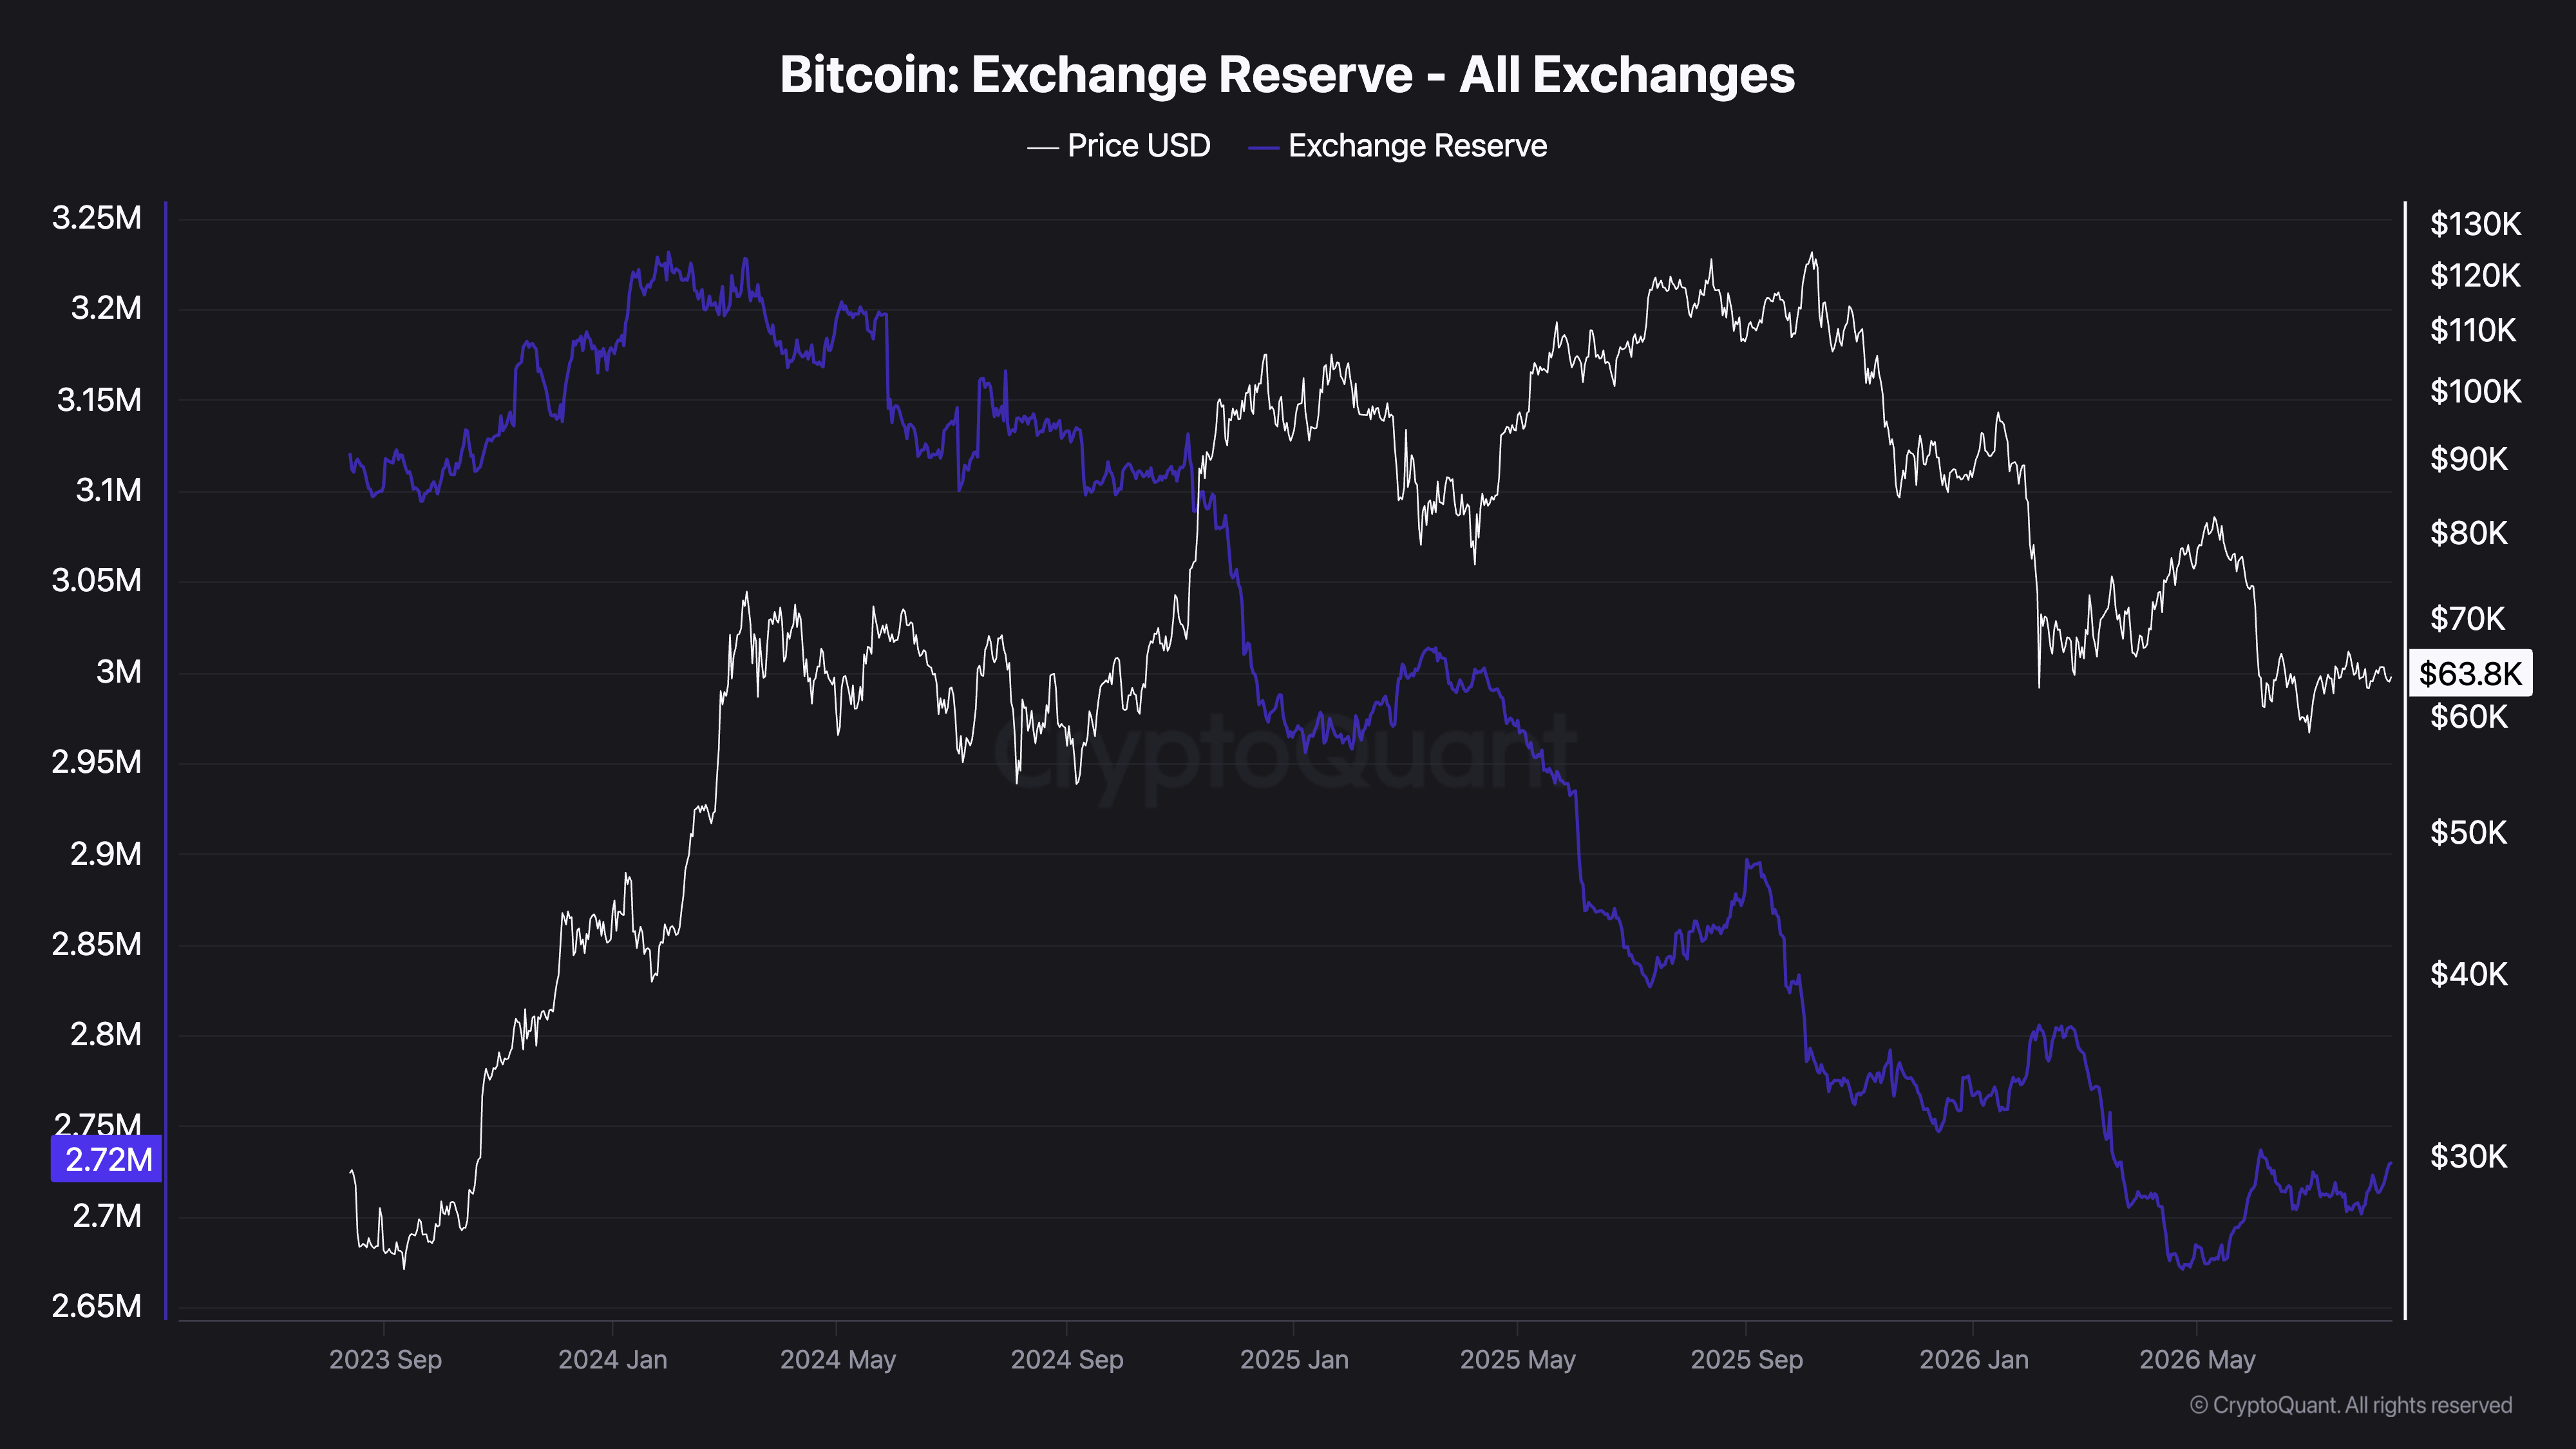
Exchange Reserve
This tracks the total amount of a cryptocurrency sitting in exchange wallets. A declining exchange reserve over time generally indicates that holders are moving coins into private wallets, which is often interpreted as a sign of reduced near-term selling pressure.
Exchange Inflow and Outflow
Inflow is the amount moving onto exchanges. Outflow is the amount leaving exchanges. Traders watch the balance of these two. Large spikes in inflow, particularly from known whale wallets, are one of the signals traders look at before a potential price decline.
Exchange Whale Ratio
This metric shows what percentage of total exchange inflow comes from the top ten largest transactions. A high whale ratio suggests that large holders are moving significant amounts onto exchanges, which can indicate selling intent.
Fund Flow Ratio
The ratio of exchange inflows to total on-chain transaction volume. A higher ratio means a larger share of all on-chain activity is exchange-directed, which can signal increased trading interest or distribution behavior.
Miner Position Index (MPI)
Miners are a significant force in Bitcoin's market because they receive BTC as block rewards and must periodically sell to cover operational costs. The MPI tracks when miners are selling above or below their historical average. High MPI values have historically preceded price corrections.
Open Interest and Funding Rates
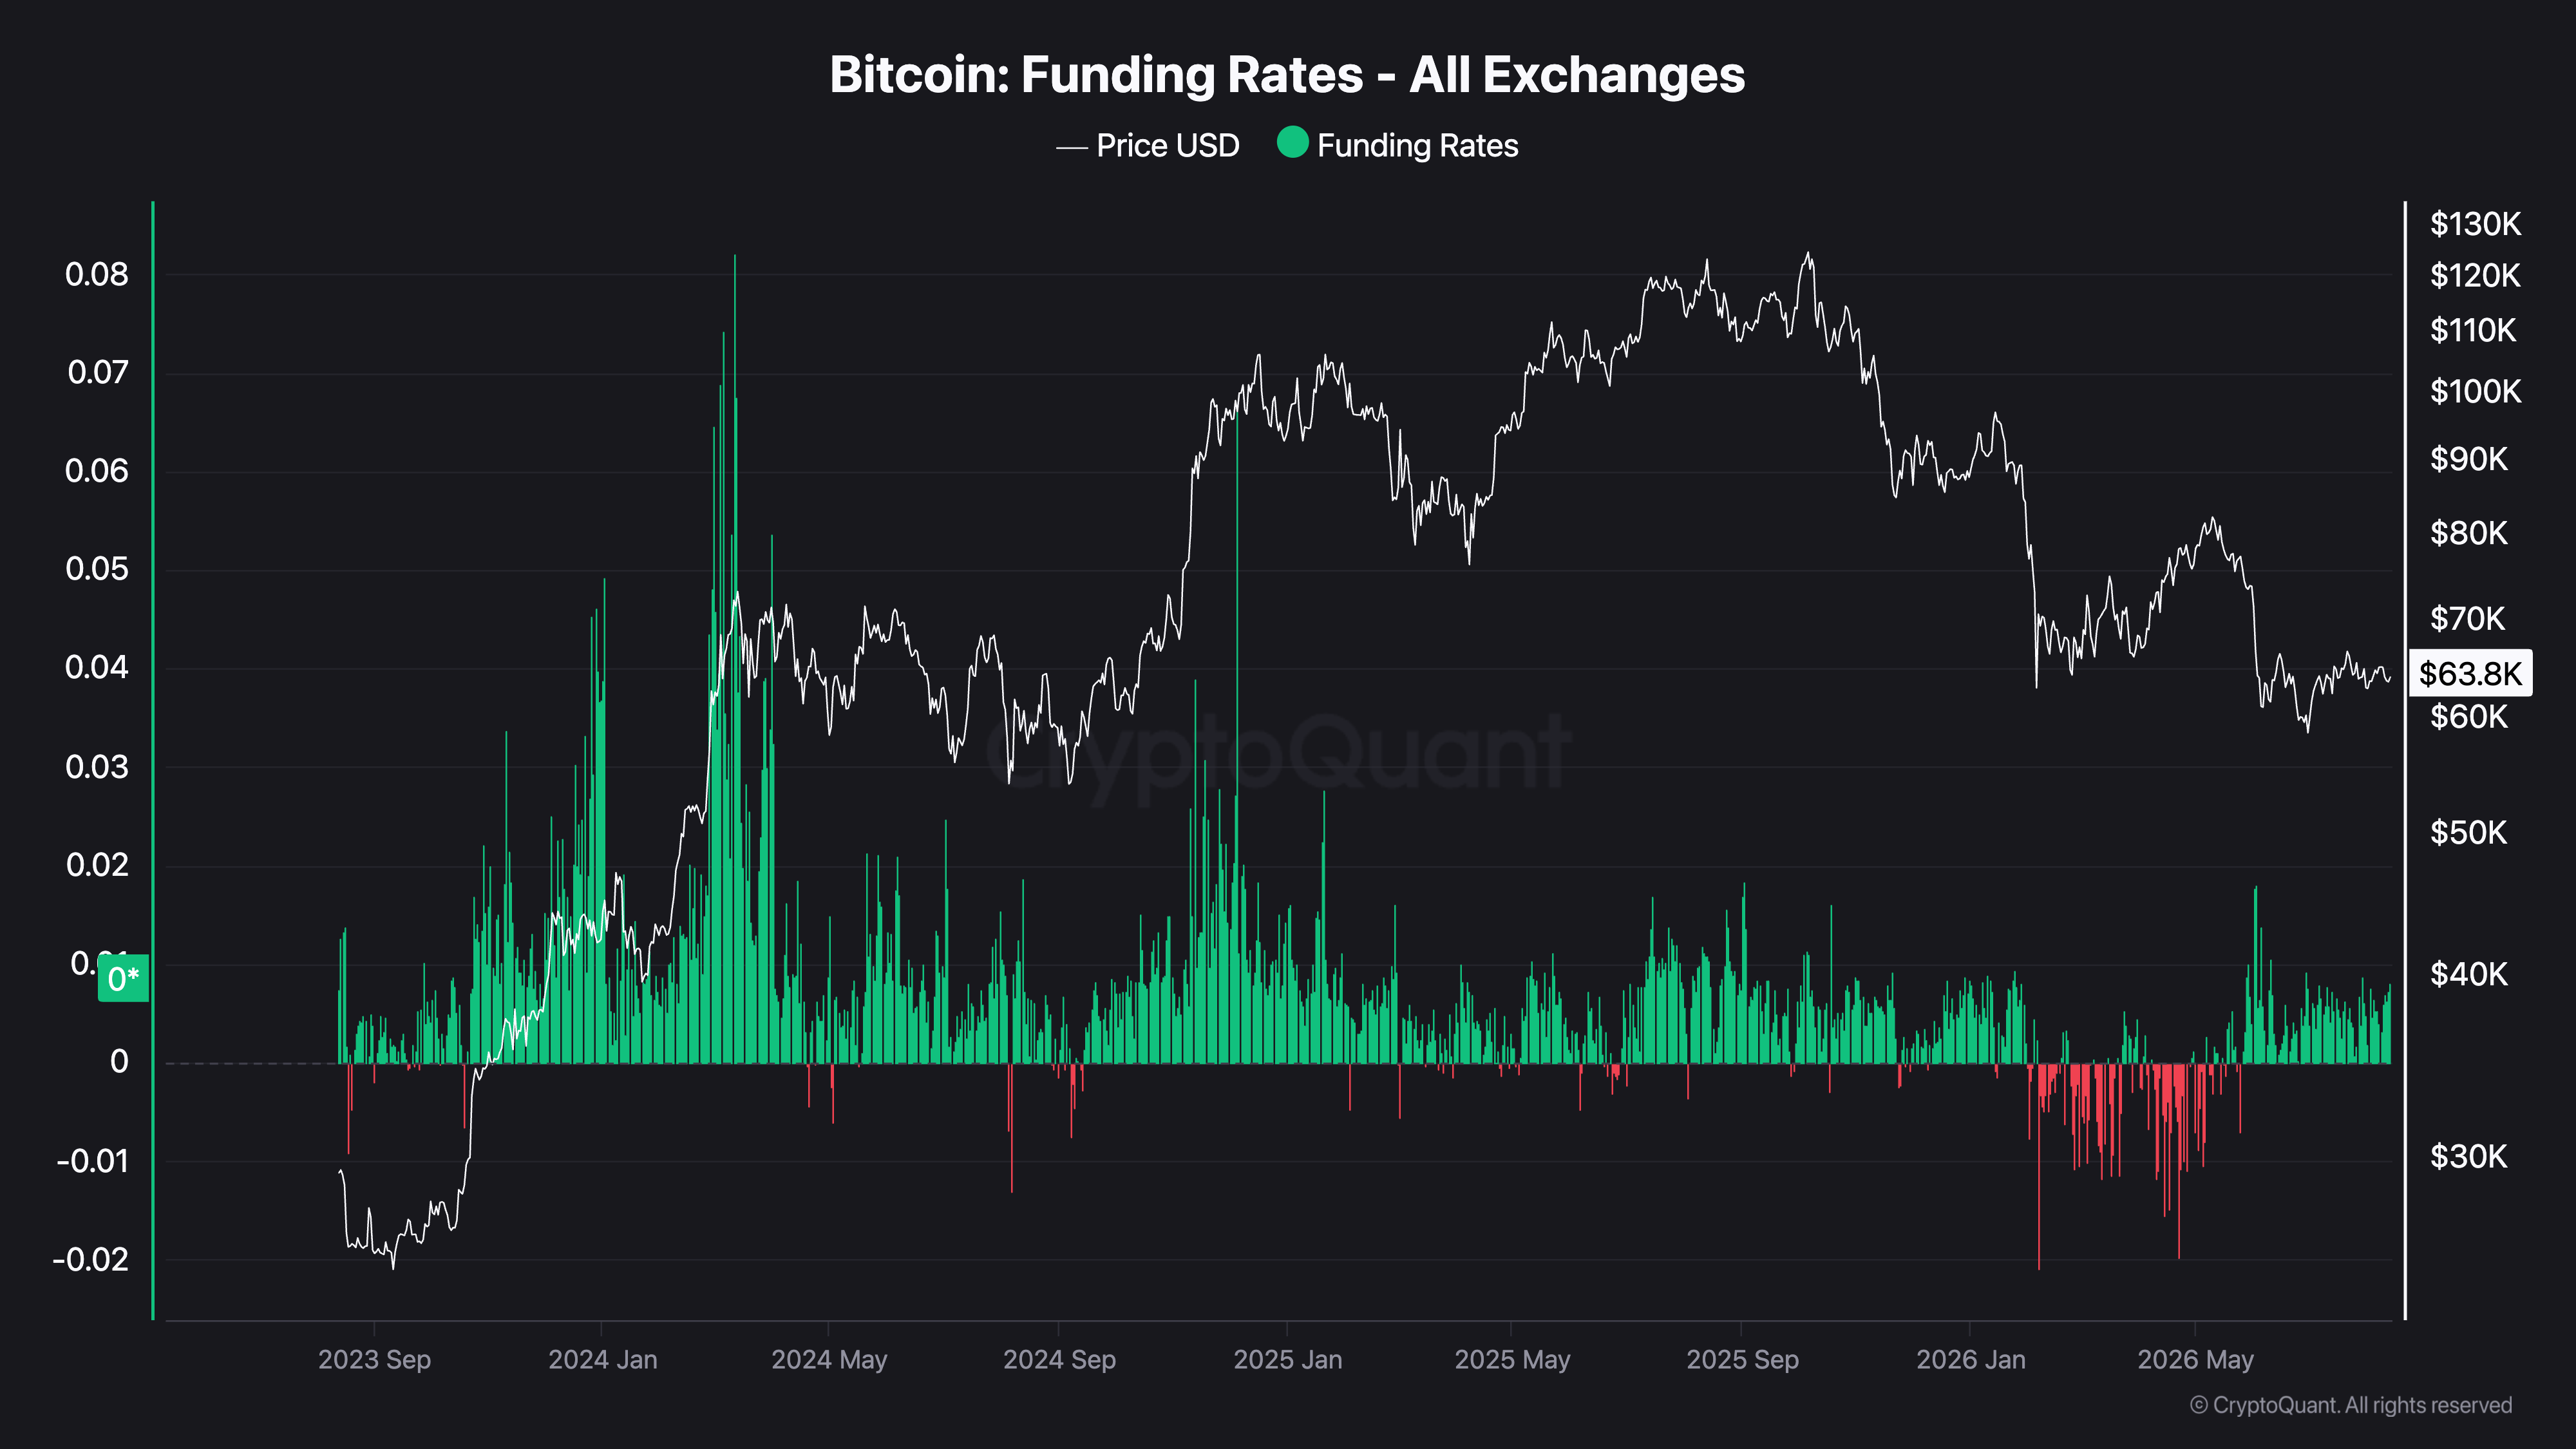
CryptoQuant also tracks derivatives market data including open interest (the total value of outstanding futures contracts) and funding rates (the cost of holding leveraged long or short positions). These metrics help traders understand whether the market is over-leveraged and in what direction.
CryptoQuant vs. Glassnode
CryptoQuant and Glassnode are the two most frequently compared on-chain analytics platforms. They overlap in some areas but have distinct strengths.
Feature | CryptoQuant | Glassnode |
Exchange flow data | Core strength | Available |
Derivatives and funding rates | Strong | Available |
Macro cycle indicators (MVRV, HODL waves) | Available | Core strength |
Miner data | Strong | Available |
Free tier | Yes | Yes |
Best for | Short-to-medium term market timing | Long-term cycle analysis |
Most experienced traders use both tools in combination rather than treating them as alternatives.
How Beginners Can Start Using CryptoQuant
Step 1: Go to cryptoquant.com and create a free account.
Step 2: Navigate to the Bitcoin section and open the Exchange Reserve chart. Observe whether the reserve has been trending up or down over the past several months.
Step 3: Check the Exchange Inflow chart. Look for unusual spikes that may indicate large wallets are moving coins to exchanges.
Step 4: Explore the Funding Rate chart under the Derivatives section. Positive funding rates mean longs are paying shorts, which can indicate an overheated long-biased market.
The free tier provides access to a meaningful subset of CryptoQuant's data. Not every metric is available without a paid plan, but beginners can extract genuine value from the free version while learning the platform.
What CryptoQuant Does Not Tell You
CryptoQuant shows you what is happening on-chain, particularly around exchanges. It does not tell you why it is happening or what the price will do next. A large exchange inflow can be a hedge, a transfer between internal exchange wallets, or preparation for selling. Context matters.
The platform also does not cover altcoins as thoroughly as it covers Bitcoin and Ethereum. For traders focused on smaller tokens, other tools like DEXTools or Nansen may provide more relevant data.
Pros and Cons
Pros:
The most comprehensive exchange flow dashboard available, covering data from over 200 exchanges and providing deeper granularity on inflows, outflows, and whale behavior than most competing tools
Strong derivatives coverage, including funding rates, open interest, and liquidation data, making it useful for futures traders as well as spot traders
Regular research contributions from analysts in the CryptoQuant community, which adds context to raw data and makes the platform educational as well as analytical
Cons:
Coverage depth is strongest for Bitcoin and Ethereum; altcoin data quality varies and is significantly thinner for smaller assets
Some of the most valuable features, including full exchange inflow breakdowns by wallet size and advanced miner data, require a paid subscription
Interpreting exchange flow data correctly requires experience; misreading signals is a common beginner mistake that can lead to poor decisions
FAQ
Is CryptoQuant free to use? Yes, there is a free tier. It provides access to a selection of key charts including exchange reserves, inflows, and outflows for Bitcoin. The Pro plan and above unlock more metrics and faster data. Current pricing is available on the CryptoQuant website.
What is exchange inflow and why does it matter? Exchange inflow refers to cryptocurrency moving from private wallets onto exchange wallets. Large inflows can indicate selling intent, particularly when they originate from known whale addresses. They do not guarantee a price decline but are one data point traders monitor.
How is CryptoQuant different from Glassnode? CryptoQuant focuses more heavily on exchange-level activity and derivatives data, making it more suited to short-term market timing. Glassnode has stronger macro cycle indicators and long-term holder behavior analysis.
Can CryptoQuant predict price movements? No tool can reliably predict price. CryptoQuant provides data about observable on-chain activity. How that activity correlates with future price is always uncertain and should never be treated as a guaranteed signal.
Does CryptoQuant cover altcoins? Yes, but coverage is significantly deeper for Bitcoin and Ethereum. Altcoin data is available but more limited in scope and granularity.
Related Terms
Disclaimer: This content is for educational and informational purposes only and is not financial advice. Nothing here is a recommendation to buy or sell any asset or use any platform. Do your own research and manage your risk.