Key Takeaways
1 | On-chain analytics lets you read blockchain data directly, giving you visibility into how smart money wallets, protocols, and tokens are actually behaving, not just what the price is doing. |
2 | Nansen, Arkham Intelligence, and Token Terminal each serve different research needs. Nansen tracks wallet behaviour and capital flows, Arkham maps wallet identities, and Token Terminal measures protocol revenue and fundamentals. |
3 | All three platforms offer free tiers with meaningful functionality. You do not need to pay for a subscription to start learning on-chain research. |
Price charts show you what happened. On-chain analytics shows you why.
When a large wallet accumulates a token before a price move, that activity is recorded on a public blockchain. When a protocol's revenue increases or collapses, that data is verifiable on-chain. When a whale exits a position, the transaction is there for anyone to see.
The challenge for most beginners is not access to this data. Blockchain data is public and free. The challenge is knowing how to read it and which tools make the process practical.
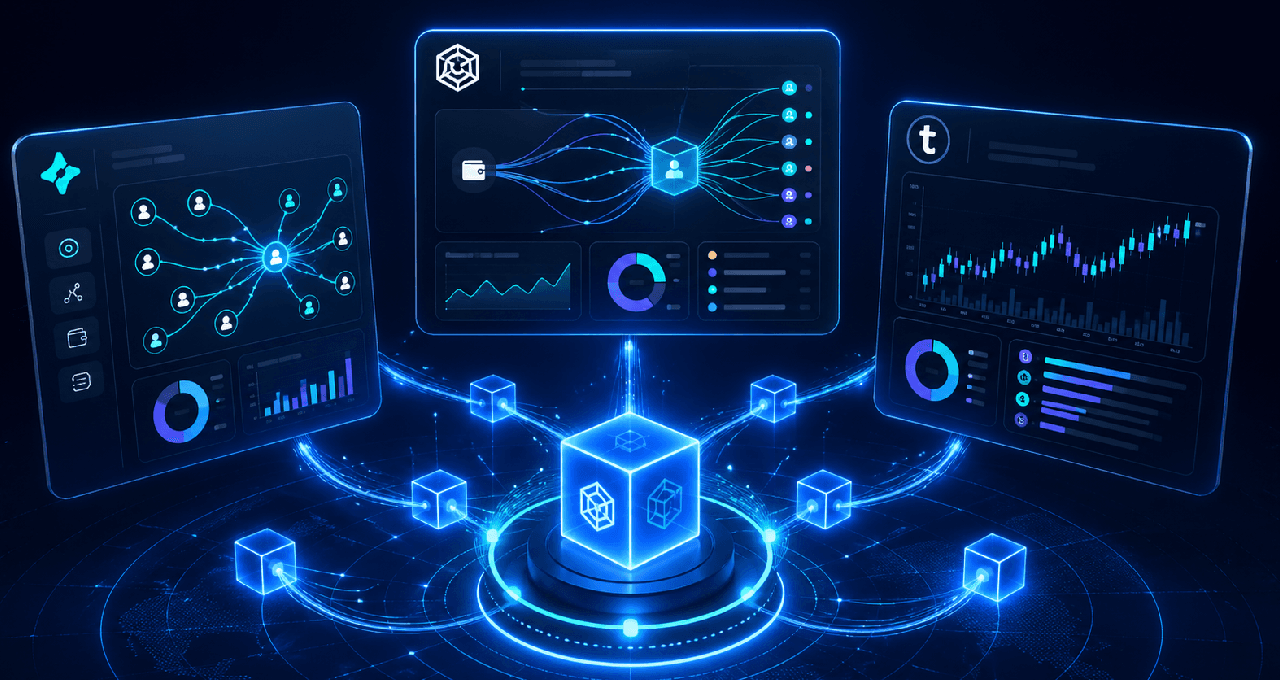
This guide walks you through three of the most widely used on-chain analytics platforms: Nansen, Arkham Intelligence, and Token Terminal. Each tool solves a different problem. Together, they give you a meaningful research edge.
What Is On-Chain Analytics and How Is It Different From Price Charts?
A price chart aggregates trading activity from centralised exchanges. It shows open, high, low, and close prices, volume, and price history. It tells you the outcome of trading decisions.
On-chain analytics reads data directly from the blockchain. This includes wallet addresses, token transfers, smart contract interactions, protocol usage, and liquidity movements. It tells you what the participants are actually doing.
Price Charts Tell You | On-Chain Analytics Tells You |
What the price is | Who is moving large positions |
Volume over time | Whether smart money is buying or selling |
Historical price levels | How much revenue a protocol generates |
Trading patterns | Token concentration and whale wallet behaviour |
Exchange-reported volume | Actual on-chain transaction volume |
Used together, price charts and on-chain data give a more complete picture than either alone. Most serious researchers use both.
Tool 1: Nansen
Website: nansen.ai
Best for: Tracking smart money wallet behaviour and capital flows across chains.
What Nansen Does
Nansen indexes blockchain data and attaches labels to millions of wallet addresses. These labels are derived from on-chain behaviour patterns and, in some cases, verified identities. When a wallet labelled as "Smart Money" or "Top NFT Trader" starts accumulating a token, Nansen surfaces that activity.
The platform tracks activity across Ethereum, Binance Smart Chain, Polygon, Arbitrum, and other major networks. It aggregates this into dashboards that show token flows, wallet movements, DEX trades, and more.
Key Features
Smart Money tracking: See which high-performing wallets are buying or selling a specific token
Token God Mode: A deep-dive view of any token including holder changes, exchange flows, and smart money interactions
Wallet Profiler: Enter any wallet address to see its full transaction history and PnL
NFT Paradise: Tracks smart money activity in NFT collections
Exchange flow tracker: Monitors tokens moving to and from centralised exchanges (large inflows can signal sell pressure)
How to Use Nansen: A Beginner Use Case
Scenario: You want to know whether informed wallets are accumulating a token you are researching.
Go to nansen.ai and search the token name or contract address
Open Token God Mode for that token
Look at the Smart Money tab. Filter for wallets labelled as Smart Money or Venture Capital
Check whether net smart money flow is positive (accumulation) or negative (distribution) over the past 7 and 30 days
Cross-reference this with exchange flow data. High smart money buying combined with tokens moving off exchanges is generally a constructive signal
Important: Smart money wallets are identified by historical performance, not by guaranteed future accuracy. A wallet labelled as smart money has performed well historically. It does not mean every trade that wallet makes will be profitable.
Nansen: Free vs Paid
Feature | Free Tier | Paid Tier |
Basic token search | Yes | Yes |
Smart Money tracking | Limited (7-day) | Full historical data |
Token God Mode | Partial | Full access |
Wallet profiler | Basic | Full PnL + labels |
API access | No | Yes |
Alert system | No | Yes |
Price (approx) | Free | From ~$150/month |
Tool 2: Arkham Intelligence
Website: arkm.com
Best for: Wallet profiling, entity labelling, and tracking named organisations on-chain.
What Arkham Does
Arkham Intelligence focuses on connecting wallet addresses to real-world entities. Its "Ultra" de-anonymisation system uses transaction graph analysis, clustering algorithms, and public data to label wallets as belonging to exchanges, funds, DAOs, protocols, or known individuals.
The platform also runs an intelligence marketplace where analysts can submit and purchase wallet labels, creating a crowdsourced layer on top of on-chain data. Arkham launched its own exchange in 2024, though its analytics platform remains its core product for research purposes.
Key Features
Entity pages: View the on-chain activity of named entities like Binance, Coinbase, a16z, or specific DeFi protocols
Transaction graph: Visualise the flow of funds between wallets and trace where assets originated
Intel marketplace: Browse or purchase labelled wallet intelligence from community contributors
Portfolio tracker: Follow the token holdings of any tracked entity or wallet
Alert system: Set alerts for when a tracked wallet makes a significant transaction
How to Use Arkham: A Beginner Use Case
Scenario: You want to track what a known venture capital fund is holding and whether they have moved any tokens recently.
Go to arkm.com and search for the fund name in the entity search bar
Open their entity page to see current holdings and historical transactions
Check the Transfers tab to see recent outflows. Large transfers to exchange wallets may indicate an intent to sell
Use the Transaction Graph to trace where the tokens went and whether a pattern is visible across multiple wallets
Set a free alert to be notified if the entity moves more than a threshold amount in the next 24 hours
Note: Arkham's entity labels are probabilistic. The platform uses machine learning and community intelligence, which means some labels carry more certainty than others. Look for labels with high confirmation scores when making decisions based on entity identification.
Arkham Intelligence: Free vs Paid
Feature | Free Tier | Paid Tier |
Entity search | Yes | Yes |
Transaction history | Limited view | Full history |
Transaction graph | Basic | Advanced visualisation |
Intel marketplace | Browse only | Purchase intel |
Alerts | Limited | Custom threshold alerts |
API access | No | Yes |
Price (approx) | Free | From ~$150/month |
Tool 3: Token Terminal
Website: tokenterminal.com
Best for: Protocol revenue, fundamentals analysis, and valuation metrics for DeFi and crypto applications.
What Token Terminal Does
Token Terminal applies traditional financial analysis frameworks to crypto protocols. It tracks revenue, earnings, total value locked (TVL), price-to-sales ratios, monthly active users, and other metrics that are more familiar to investors from the equities world.
The platform covers over 100 protocols including decentralised exchanges, lending platforms, layer-1 blockchains, and infrastructure projects. Its data is sourced directly from smart contract events, making it verifiable and transparent.
Key Features
Revenue and earnings dashboards: Compare actual protocol-generated fees across categories
Price-to-sales (P/S) ratio: Compare how a token is valued relative to the revenue its protocol generates
Monthly active users: Track genuine user growth or decline over time
Token Incentives: See how much a protocol is spending on token incentives vs how much it earns in fees
Sector comparison: Compare metrics across DeFi categories to understand relative performance
How to Use Token Terminal: A Beginner Use Case
Scenario: You want to compare two DEX protocols to understand which one has stronger fundamentals.
Go to tokenterminal.com and open the Projects section
Filter by category: Decentralised Exchanges
Sort by Revenue (trailing 30 days) to see which protocols are generating the most fees
Compare the P/S ratio for your two target protocols. A lower ratio relative to peers may indicate undervaluation, though it requires context
Check the Token Incentives line. If a protocol is spending more on token incentives than it earns in fees, its apparent growth may not be sustainable
Token Terminal treats crypto protocols like businesses. Revenue is the fees paid by users. Earnings are revenue minus token incentive costs. This framework is useful for separating protocols with real economic activity from those that exist primarily to distribute tokens.
Token Terminal: Free vs Paid
Feature | Free Tier | Paid Tier |
Project dashboard | Yes | Yes |
Revenue charts | 30-day view | Full historical |
P/S ratio | Yes | Yes |
Custom charts | No | Yes |
CSV export | No | Yes |
API access | No | Yes |
Price (approx) | Free | From ~$59/month |
Which Tool Should You Use for What?
Research Goal | Best Tool | Specific Feature | Free Available? |
Smart money tracking | Nansen | Token God Mode / Smart Money tab | Partial |
Wallet identity check | Arkham Intelligence | Entity search / Transaction graph | Yes |
Whale alert watching | Arkham Intelligence | Alert system | Limited |
Protocol revenue comparison | Token Terminal | Revenue/Earnings dashboard | Yes |
Token valuation metrics | Token Terminal | P/S ratio, fee data | Yes |
VC fund activity tracking | Arkham Intelligence | Entity portfolio view | Yes |
Exchange flow monitoring | Nansen | Exchange flow dashboard | Partial |
Token holder changes | Nansen | Token God Mode | Partial |
Putting It All Together: A Sample Research Workflow
Here is how you might combine all three tools when evaluating a new DeFi protocol:
Start with Token Terminal to check whether the protocol generates real revenue, how it compares to sector peers by P/S ratio, and whether token incentives exceed fee income
Move to Nansen to check whether smart money wallets have been accumulating the token and whether exchange flows suggest selling pressure or quiet accumulation
Use Arkham to identify any known entities (funds, DAOs, or large protocols) holding the token, and check whether any have made large recent transfers to exchange wallets
Combine this with your on-chain tokenomics check from E-11 (wallet concentration, vesting unlocks) for a complete picture
No single data point is definitive. Smart money is sometimes wrong. Revenue can be manipulated. Entity labels can be incorrect. The value of on-chain analytics is that it gives you access to a layer of verifiable information that most retail investors never look at.
Acting on Your Research
Once your on-chain research points toward a view, you need a platform to execute. Several exchanges offer good tooling for informed traders:
OKX: OKX offers advanced spot and derivatives trading with strong charting integration.
Bybit: Bybit provides a wide range of markets and is widely used by active traders.
TradingView: TradingView remains the standard for charting, screeners, and price alert setup alongside your on-chain work.
None of the above are endorsements of trading decisions. Where you choose to trade is a separate decision from the research methodology in this guide.
Frequently Asked Questions
Is on-chain analytics only useful for DeFi?
No. On-chain analytics applies to any blockchain-based asset. You can track Bitcoin wallet movements using tools like Glassnode or CryptoQuant, and Ethereum-based token flows with Nansen and Arkham. Token Terminal focuses primarily on DeFi protocols, but the broader category of on-chain research covers all chains and asset types.
Do I need to understand code to use these tools?
No coding skills are required to use any of the three platforms covered in this guide. Nansen, Arkham, and Token Terminal are designed for visual navigation. Reading raw blockchain data from a block explorer like Etherscan requires some familiarity with transaction structures, but the tools abstract most of that for you.
How reliable are the wallet labels in Nansen and Arkham?
Labels on both platforms are probabilistic rather than absolute. Nansen derives labels from behavioural clustering and historical performance. Arkham uses algorithmic de-anonymisation supplemented by community intelligence. In both cases, high-confidence labels are generally reliable. Low-confidence labels should be treated as hypothesis rather than fact.
Is Arkham Intelligence free to use?
Arkham offers a meaningful free tier that includes entity search, basic transaction history, and a portfolio view for tracked entities. The paid tier adds advanced graph analysis, alert customisation, and API access. For most beginners, the free tier is sufficient to get started.
What is the difference between TVL and protocol revenue?
Total Value Locked (TVL) is the amount of assets deposited in a protocol. Revenue is the actual fees charged to users. TVL can be inflated by token incentives that attract temporary deposits. Revenue is harder to fake and a better indicator of genuine product-market fit. Token Terminal focuses primarily on revenue metrics for this reason.
Can on-chain analytics predict price movements?
No tool can reliably predict price. On-chain analytics provides context about participant behaviour and protocol health. This context can inform a research-based view, but it does not guarantee outcomes. Markets are influenced by many factors beyond on-chain data, including macro conditions, regulatory news, and sentiment.
Disclaimer: This content is for educational and informational purposes only and is not financial advice. Nothing here is a recommendation to buy or sell any asset or use any platform. Do your own research and manage your risk.
Read More
Need deeper training?
Join our structured modules with live examples and expert checklists for effective implementation.
JOIN THE ACADEMY