In the chaos of a crypto winter, it’s easy to get lost in the noise. The constant barrage of red candles, panicked headlines, and conflicting opinions can lead to emotional decision-making and costly mistakes.
To navigate this treacherous environment, you need a dashboard—a clear, concise set of indicators that can help you cut through the noise and understand the true state of the market. Here are the top 5 indicators every crypto trader should be watching in the 2026 bear market.
1. The 200-Week Moving Average (The Ultimate Line in the Sand)
If there is one indicator that has historically defined the bottom of every Bitcoin bear market, it is the 200-week moving average (200W MA). This long-term trend line has acted as the ultimate floor for Bitcoin’s price, a line in the sand that has never been decisively broken.
Why it Matters: The 200W MA represents the average price of Bitcoin over the past four years. A drop to this level signifies a full reset of the market cycle, washing out all the speculative excess of the bull run.
Current Level: As of February 2026, the 200W MA is sitting around $32,000 (note: recent data shows it closer to $58,000, reflecting updated market conditions).
How to Use It: Watch for the price to approach and interact with this level. A bounce off the 200W MA could signal the bear market bottom. A decisive break below it would be an unprecedented and extremely bearish signal.
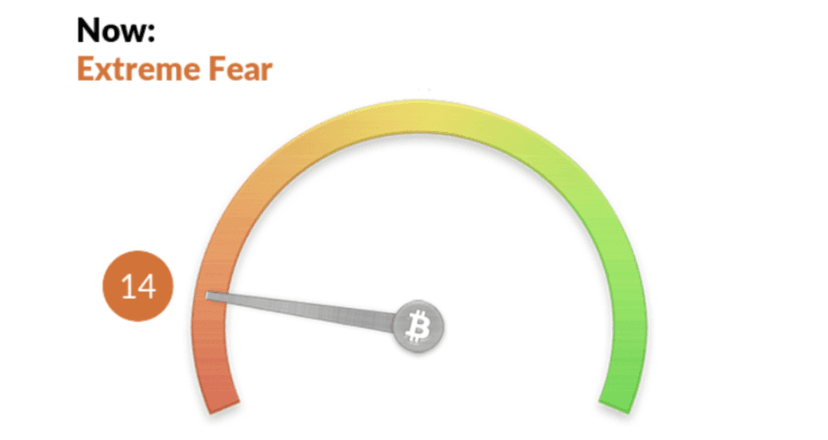
2. The Crypto Fear & Greed Index (The Sentiment Gauge)
The Crypto Fear & Greed Index is a powerful tool for gauging market sentiment. It aggregates data from multiple sources—volatility, market momentum, social media, and more—to produce a single number that represents the emotional state of the market.
Why it Matters: The market is driven by emotion. Extreme fear often marks a point of maximum pessimism and can be a strong contrarian indicator, signaling that a bottom is near. Conversely, extreme greed can signal that a top is near.
Current Level: The index is currently in “Extreme Fear” (recent readings around 7-14).
How to Use It: Look for prolonged periods of extreme fear. While not a precise timing tool, it can help you identify periods of maximum opportunity for long-term accumulation.
3. Stablecoin Flows to Exchanges (The “Dry Powder” Indicator)
On-chain data provides a transparent window into the behavior of market participants. One of the most important on-chain metrics to watch in a bear market is the flow of stablecoins (like USDT and USDC) onto exchanges.
Why it Matters: A large inflow of stablecoins to exchanges suggests that buyers are getting ready to deploy their “dry powder.” It is a sign that smart money is preparing to buy the dip, which can often precede a market bottom.
How to Use It: Use a blockchain analytics platform to monitor the “Stablecoin Supply Ratio” (SSR) and net exchange flows. A spike in inflows after a significant price drop can be a powerful bullish signal.
4. The Bitcoin Dominance Chart (The Altcoin Litmus Test)
Bitcoin dominance (BTC.D) measures Bitcoin’s market capitalization as a percentage of the total crypto market cap. In a bear market, the behavior of BTC.D is a crucial indicator of risk appetite.
Why it Matters: Typically, in a risk-off environment, capital flows from more speculative altcoins into the relative safety of Bitcoin. This causes Bitcoin dominance to rise. A sustained rise in BTC.D is a classic sign of a bear market.
Current Trend: Bitcoin dominance has been rising steadily, from a low of around 40% to its current level over 55% (recent data shows around 58-59%).
How to Use It: Watch for a topping out and reversal of the BTC.D trend. A sustained decline in Bitcoin dominance would signal a return of risk appetite and could be an early sign of the next “alt season.”
5. The VIX (The Macro Fear Gauge)
Finally, it is crucial to remember that crypto does not exist in a vacuum. The CBOE Volatility Index (VIX), often called the stock market’s “fear gauge,” is a powerful indicator of macro risk sentiment.
Why it Matters: As crypto has become more correlated with traditional markets, the VIX has become an increasingly important indicator for crypto traders. A high VIX indicates fear and uncertainty in the broader financial markets, which often spills over into crypto.
How to Use It: Watch for spikes in the VIX. A VIX above 30 is generally considered a sign of high fear. A calming of the VIX and a return to a low-volatility regime in the stock market could create a more favorable environment for a crypto recovery.
Indicator | What it Measures | What to Look For in a Bear Market |
200W MA | Long-Term Trend | Price approaching and finding support |
Fear & Greed Index | Market Sentiment | Prolonged periods of “Extreme Fear” |
Stablecoin Inflows | Buying Power | A spike in inflows to exchanges |
Bitcoin Dominance | Risk Appetite | A sustained rise, followed by a reversal |
VIX | Macro Fear | A calming of the VIX below 30 |
Conclusion: Your Bear Market Compass
Navigating a crypto winter without a clear set of indicators is like sailing in a storm without a compass. By building a dashboard with these five key metrics, you can cut through the noise, understand the true state of the market, and make more informed, data-driven decisions.
The bear market is a test of patience and discipline. Use these tools to guide you, and you will be well-equipped to not just survive the winter, but to emerge from it stronger and more profitable than ever before.