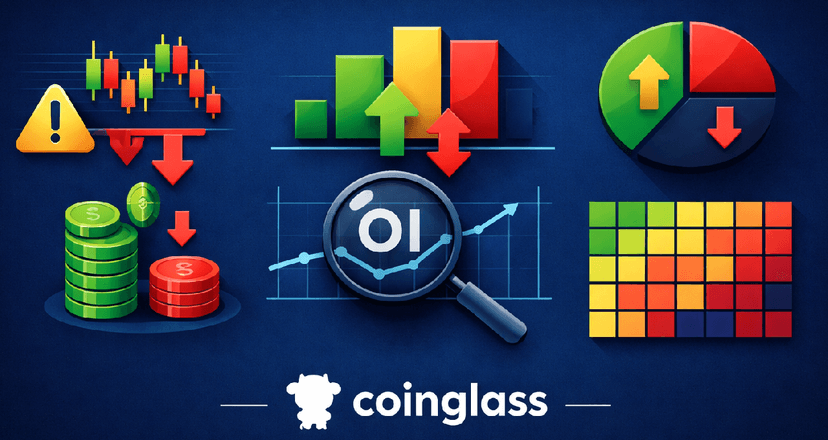
Coinglass is a free website that pulls together data from many exchanges about these leveraged trades. It shows things like total liquidations, funding rates, open interest, long/short ratios, and cool visual charts like heatmaps.
What Coinglass Really Is
Coinglass is a helpful tool that collects leverage and derivatives data from lots of exchanges. It lets you see what's happening in the futures market, which often affects regular spot prices.
Coinglass is NOT a magic crystal ball that tells you exactly where the price will go. It's not a sure reversal sign, and it can't replace good risk management like stop-losses.
Think of it like a weather app for leveraged trading: it shows if there's a storm brewing from too much borrowing, but it doesn't tell you exactly when to run outside.
The Big Idea: Leverage Makes Moves Bigger
In crypto futures, traders use leverage to control a big position with little money. If the price moves against them too much, the exchange automatically closes their trade to avoid losing more than they have. That's a liquidation.
These liquidations can create chain reactions:
Price drops → long traders get liquidated → more selling → price drops more → even more liquidations.
The same thing happens in reverse for shorts when price pumps.
Coinglass shows you signs of these chain reactions so you can understand the "why" behind wild swings.
Metric 1: Liquidations – What They Actually Mean
A liquidation happens when an exchange auto-closes a leveraged trade because the trader doesn't have enough margin left.
Coinglass liquidation charts usually show:
Total value of liquidations in a time period (like 24 hours)
Split between long liquidations and short liquidations
Big spikes during sharp price moves
How should beginners read a liquidation spike?
It usually means a bunch of leveraged traders were wrong-footed, and their forced exits made the move bigger.
It does NOT automatically mean:
"This is the bottom!"
"Time to reverse!"
"The top is in!"
A spike is a sign of market stress, not a guaranteed flip.
Metric 2: Open Interest (OI) – Super Simple Explanation
Open interest is the total value of all open futures contracts right now. Basically, it's how much leveraged money is still in the game.
Why care about OI?
It tells you if a price move comes from:
New trades being added (OI going up)
Old trades closing (OI going down)
Or a mix
Easy beginner table to read OI with price action:
Price Move | OI Change | What It Usually Means | Quick Takeaway for Beginners |
Price UP | OI UP | New buyers/leverage chasing the rally | Momentum might keep going (but watch out) |
Price UP | OI DOWN | Shorts covering or people reducing positions | Rally could be from covering, not new strength |
Price DOWN | OI UP | New shorts piling in or longs getting trapped | Down move might get stronger |
Price DOWN | OI DOWN | Positions closing, people de-risking or forced out | Could be capitulation or just calming down |
This is just context to explain volatility—not a direct "buy/sell" signal.
Metric 3: Funding Rates – The Crowd Mood Thermometer
In perpetual futures (perps), funding is a small payment every few hours between longs and shorts. It keeps the futures price close to the real spot price.
Simple rule:
Positive funding → longs pay shorts (longs are more crowded)
Negative funding → shorts pay longs (shorts are more crowded)
What it shows:
Extreme positive = lots of longs paying to stay in
Extreme negative = lots of shorts paying to stay in
Beginner tip: Crowded doesn't mean wrong! Funding can stay crazy high or low for a long time. Use it to see which side is heavy, not to bet against them right away.
Metric 4: Long/Short Ratios – Use Carefully
These ratios show the split between long and short positions.
Two quick warnings for beginners:
Different sites calculate them differently.
Traders can hold longs and shorts at the same time in different places.
Best way to use:
Watch for extreme numbers
Look at changes over time, not just one moment
Always check with price and OI
Never use long/short ratios alone to say "do the opposite"!
Metric 5: Liquidation Heatmaps – Read Them Safely
Heatmaps show where big clusters of potential liquidations sit at different price levels.
Good for:
Seeing why price sometimes races toward certain zones
Understanding spots where volatility could explode
Not good for:
Treating them as price magnets that price "must" hit
Using as exact targets
Beginner rule: Use heatmaps to know where risk hides if you're using leverage. Don't treat them like a treasure map.
Easy Beginner Routine: Check Coinglass in 3-5 Minutes Without Stress
Follow these calm steps:
Look at liquidations (last 24 hours)
Big spike? Mostly longs or shorts?
→ Helps you see if leverage caused the move.
Check open interest trend
Rising or falling during the price change?
→ Shows if new leverage is coming in or getting flushed.
Glance at funding rate
Neutral, very positive, or very negative?
→ Tell you if one side is paying a lot to hold.
Optional: peek at heatmap
Any big clusters near the current price?
→ Warns where things could speed up.
This routine is about understanding the market mood, not guessing the next price candle.
Why Spot Traders Should Care Too (Even Without Leverage)
Leverage affects spot prices too! You’ll finally get why:
Sudden dumps happen out of nowhere
Rallies feel super sharp
Volatility explodes when everyone bets the same way
It helps you stay calm and stop thinking every move is "big money insider stuff."
Common Beginner Mistakes
Using funding rate to time exact entries/exits – it can stay extreme forever.
Seeing a liquidation spike and yelling "reversal!" – it can happen in the middle of a trend.
Forgetting data comes from many exchanges – some behave differently.
Jumping into leverage without knowing how liquidation prices work – bad idea!
Simple Rules to Use Coinglass the Smart Way
Use it to explain why volatility happens, not to chase wild moves.
Spot crowding, but don't bet on instant reversals.
If you're new, keep trades tiny or practice on paper trading.
Never enter a trade based only on one Coinglass number.
Quick FAQ for Beginners
What are liquidations in crypto?
When an exchange forces a leveraged trade closed because the trader ran out of margin.
Does a liquidation spike mean the price will reverse?
Not always. It shows stress, but the trend can keep going.
What is open interest and why care?
Total open futures contracts. Rising means more leverage entering; falling means de-risking or closures.
What is the funding rate?
Payments between longs and shorts in perps. It shows which side is crowded.
Should beginners check Coinglass before trading?
Yes for context on leverage effects—but always pair it with risk management and small sizes.